Derwent Valley Vets
Matlock
Welcome to Derwent Valley Vets Ltd, a premier veterinary practice located in the charming town of Matlock in Derbyshire, England.
Vet Verified lists 89 veterinary practices in Derbyshire. Filter by species, services, facilities or whether a practice is open now, then open a profile for contact details and more information.
Open a town page to compare practices in a more specific area.
Search by species
Urgent and out-of-hours
Opening hours
Welcome to Derwent Valley Vets Ltd, a premier veterinary practice located in the charming town of Matlock in Derbyshire, England.
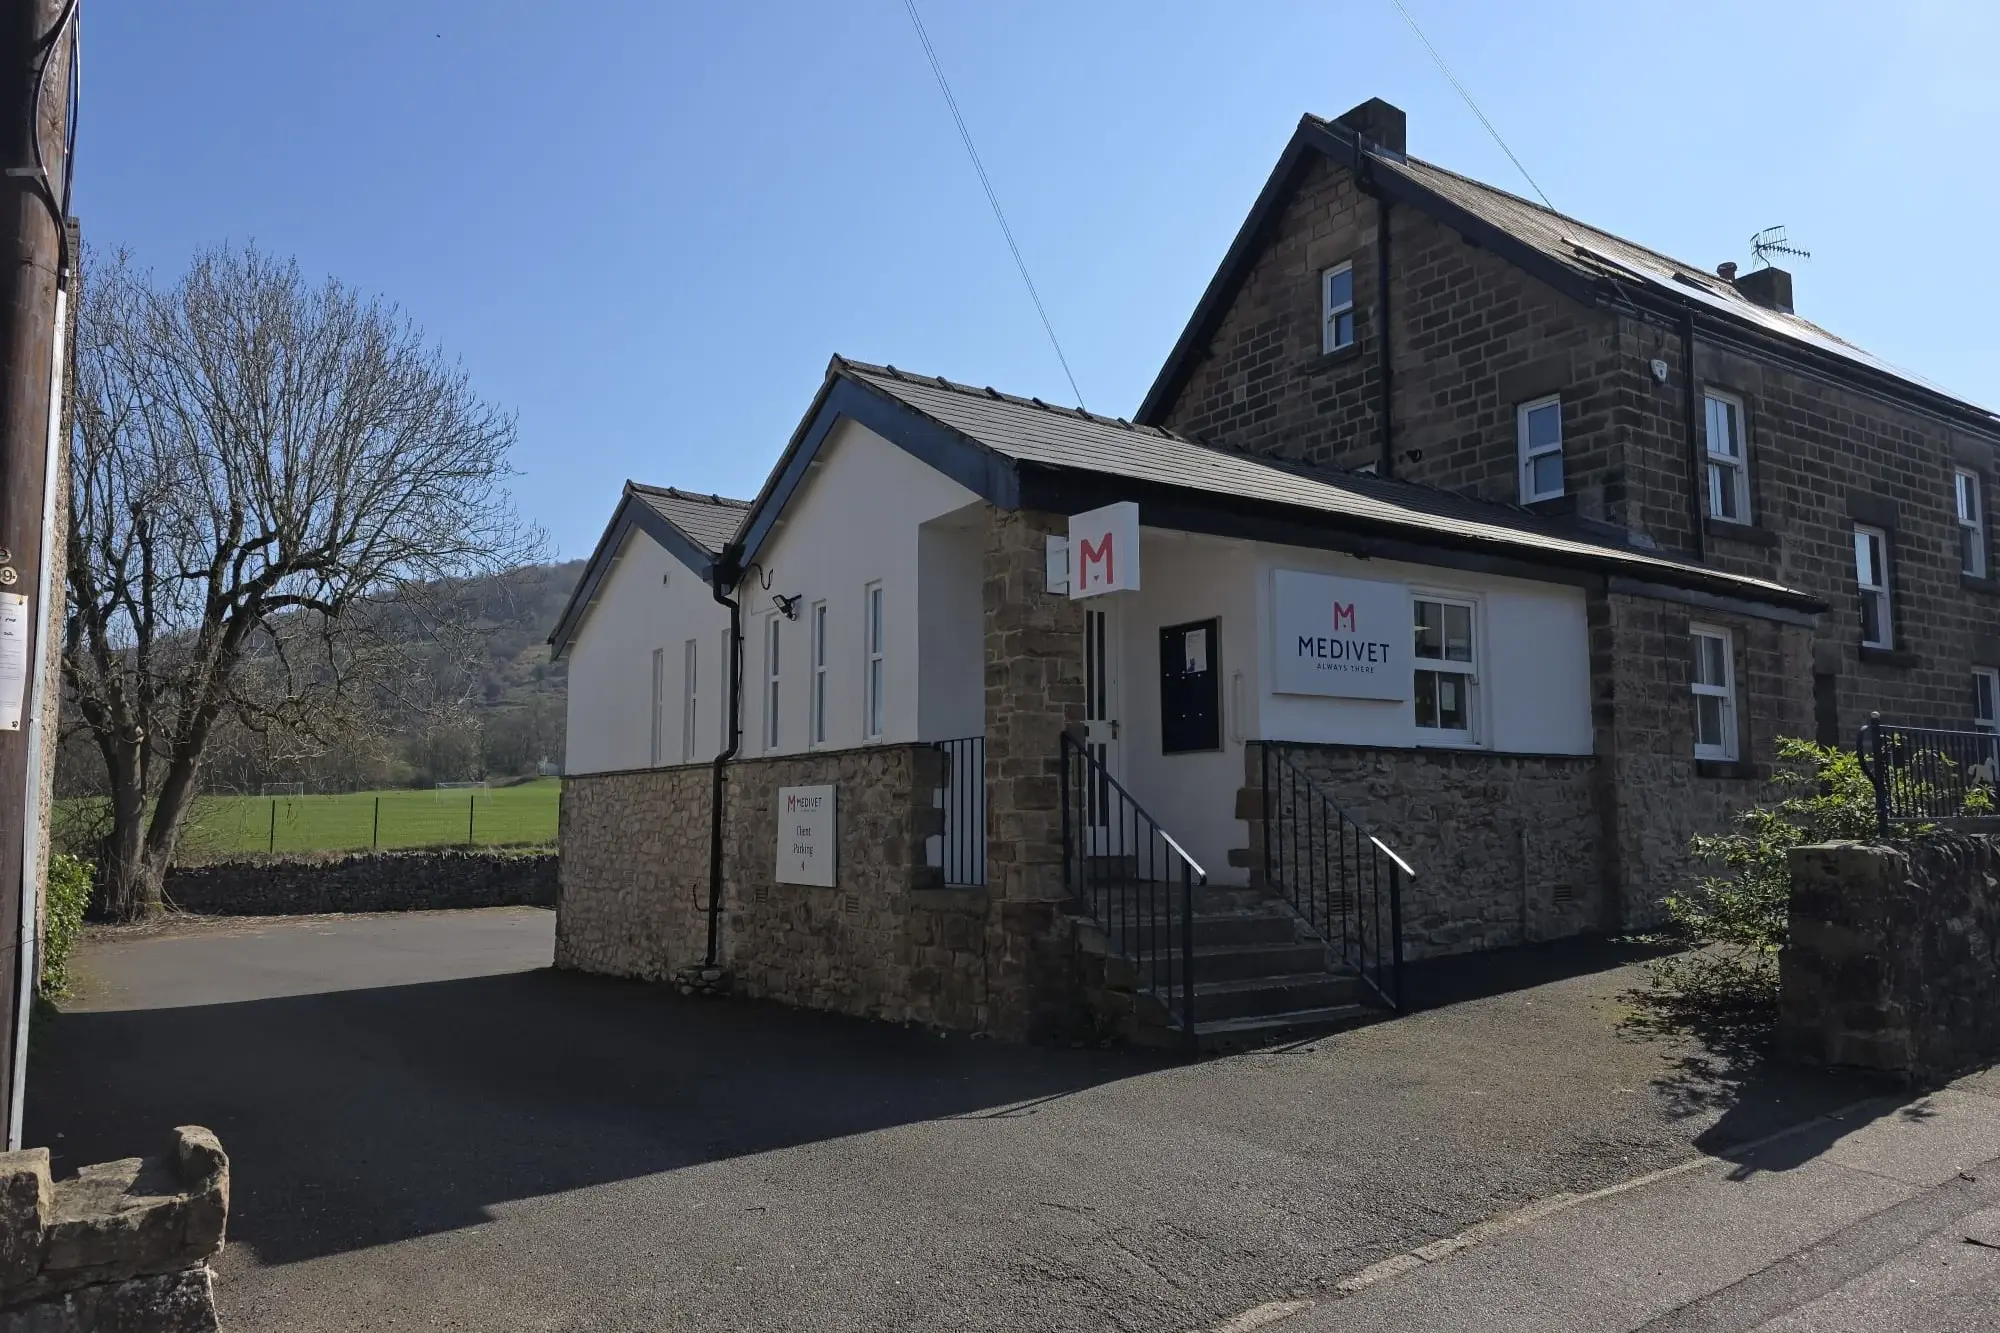

Medivet Matlock in Derbyshire offers veterinary care for birds, cats, dogs, exotics, and small mammals, with weekday hours from 8:30 am to 6:30 pm and Saturday availability.
McMurtry and Harding Vets is a veterinary practice in Wirksworth that treats pets, farm animals, and horses. The practice opens Monday to Thursday and offers dentistry, diagnostic imaging, and routine preventative care.
 Open now
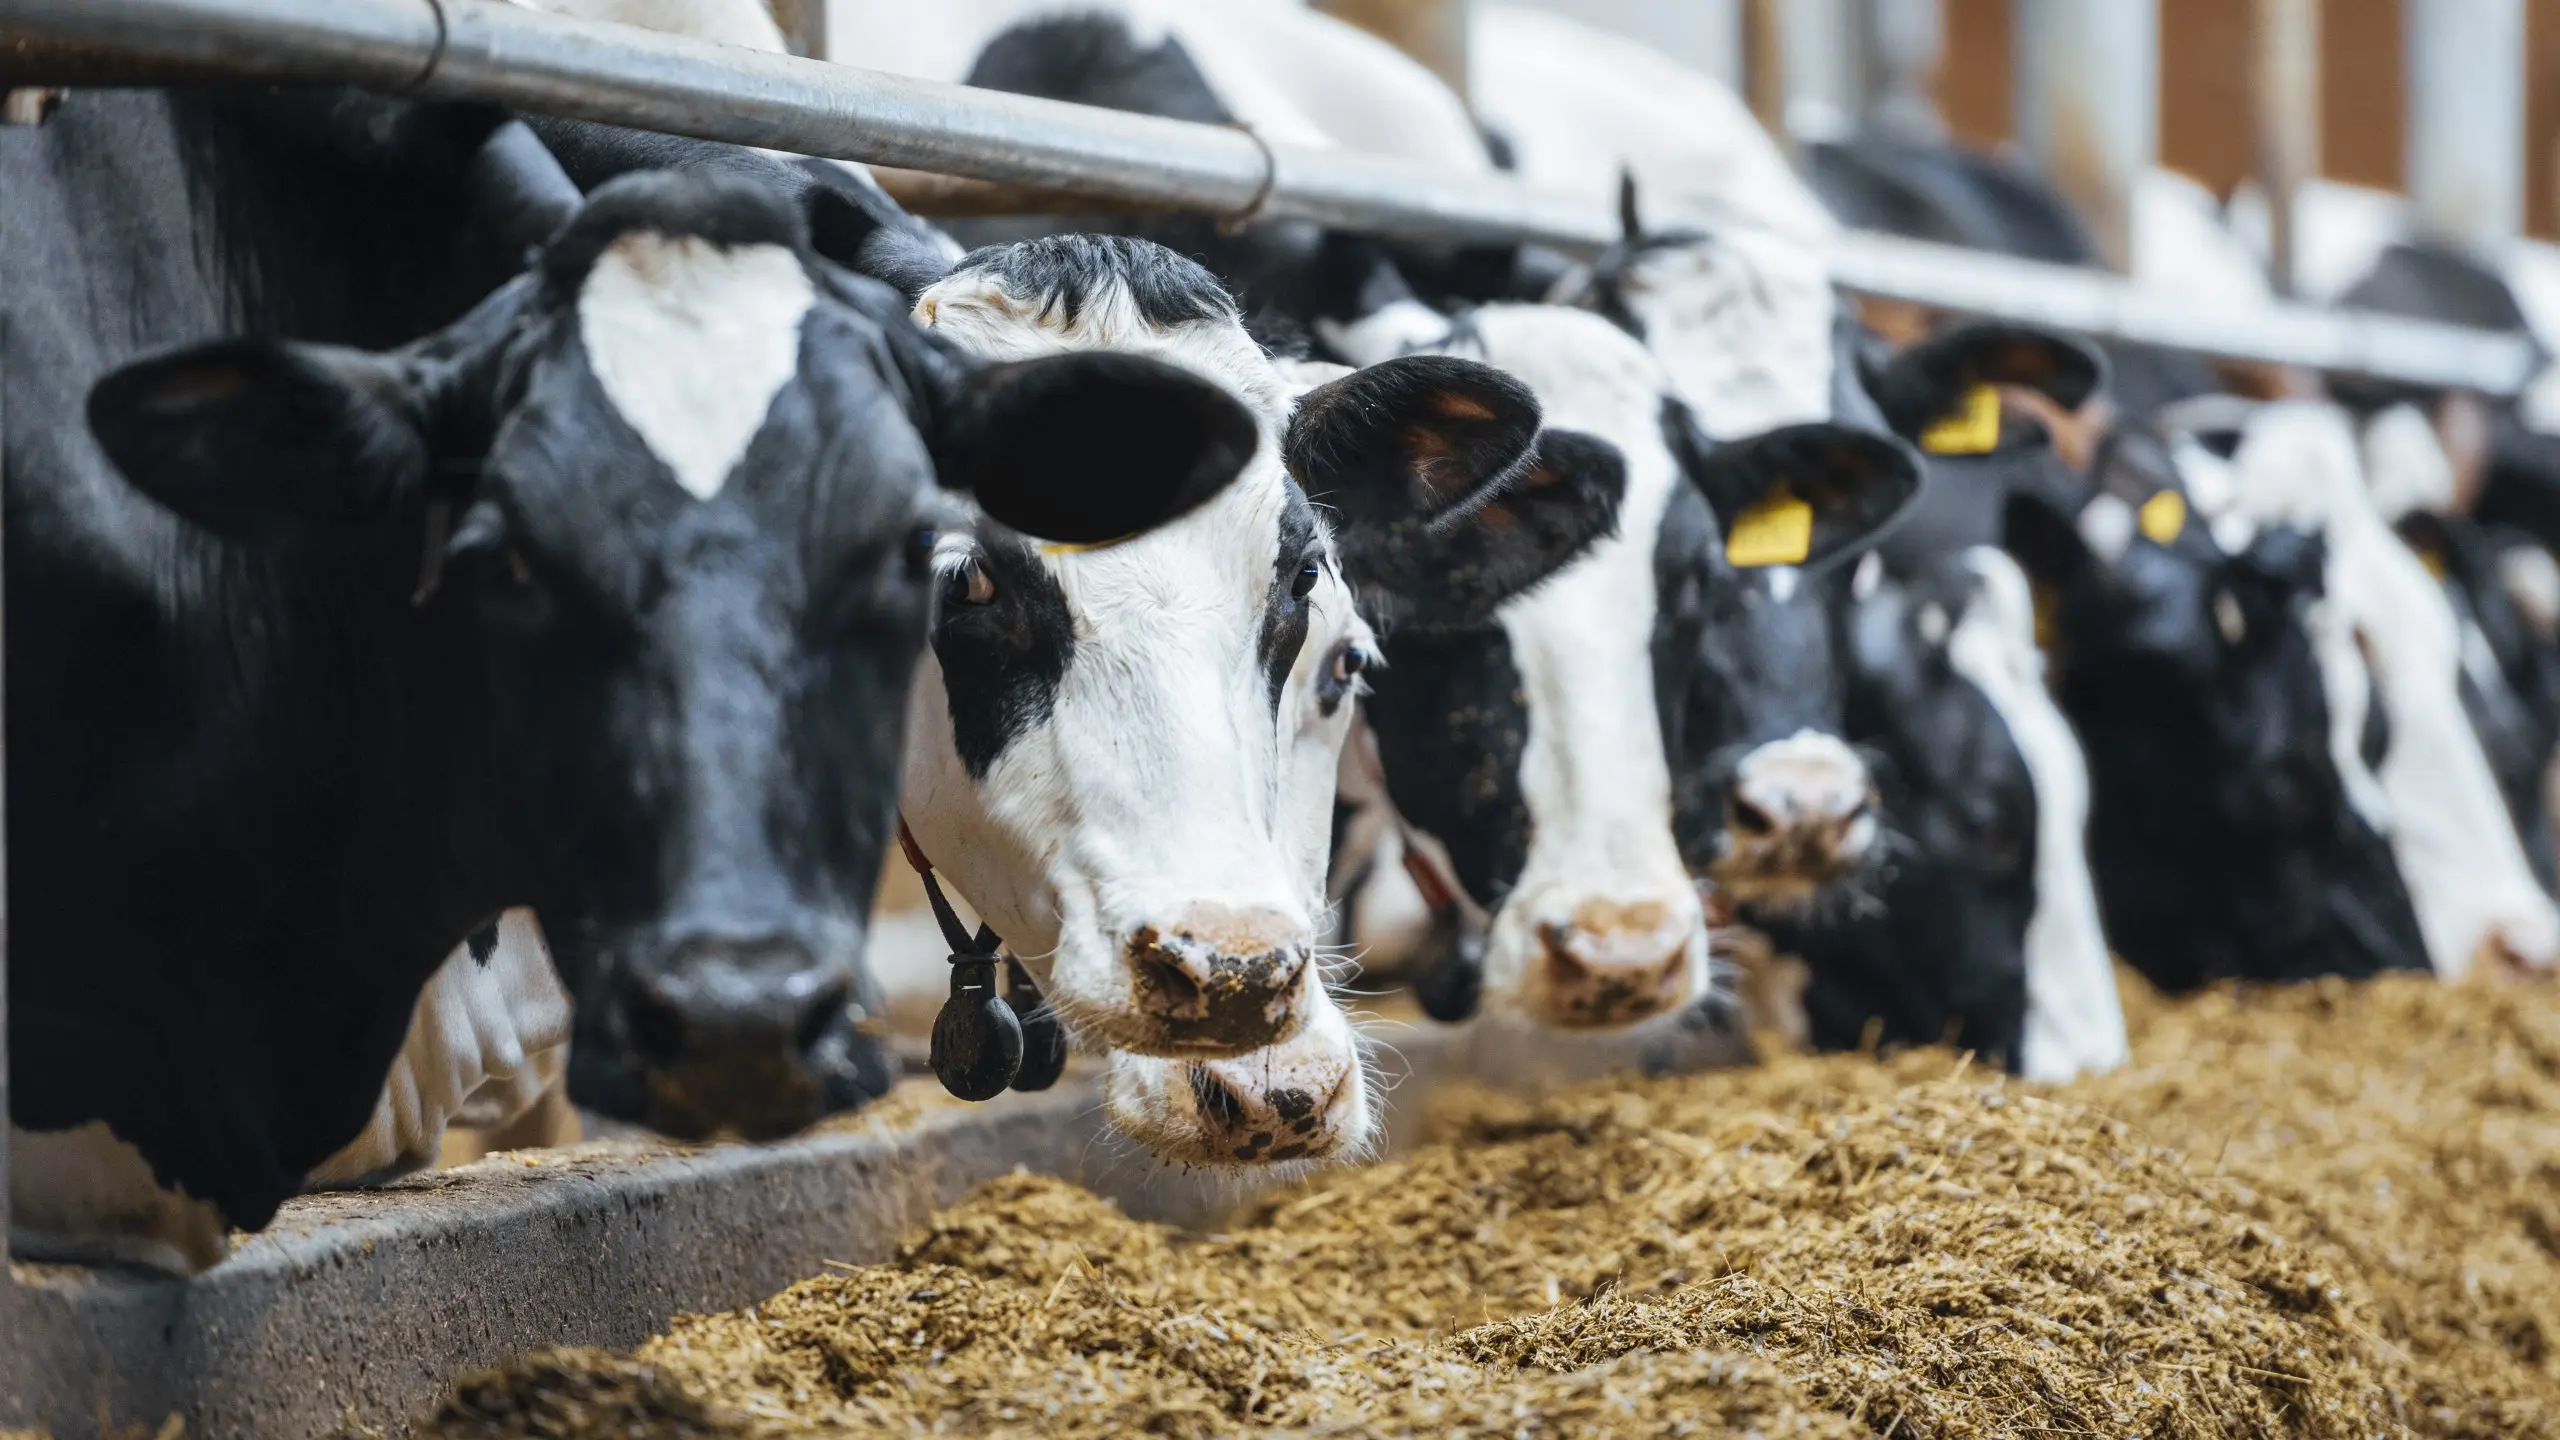
LLM Farm Vets Bakewell in Derbyshire treats cattle, sheep and goats, offering vaccinations, diagnostic imaging and a 24 hour out of hours mobile service.
Welcome to Bakewell Veterinary Clinic! This friendly and inviting veterinary practice is located in the beautiful town of Bakewell, in Derbyshire, England.
Bakewell Equine Clinic offers top-quality care for equines in a warm and welcoming environment, located in the heart of Bakewell, Derbyshire.
Welcome to Blenheim Veterinary Centre, a friendly and welcoming practice based in the picturesque town of Ashbourne, Derbyshire.
Welcome to Marshall & Till, a trusted veterinary practice located in the town of Belper, Derbyshire, England.
Riverside Veterinary Centre is a veterinary practice in Belper, Derbyshire, treating cats, dogs, and small mammals. The practice offers diagnostics, dentistry, and routine preventative care. It opens at weekends and provides out-of-hours emergency support.

Welcome to Quietus Vet, the caring veterinary practice in Alfreton, Derbyshire, England.
McMurtry and Harding Vets is a veterinary practice in Clifton that treats pets, horses, and farm animals. The practice meets RCVS Core Standards and provides dentistry, diagnostic imaging, and routine preventative care.
Park Veterinary Hospital is a veterinary practice in Hope Valley, Derbyshire, treating dogs, cats, birds, small mammals, exotic pets, and poultry. Services include vaccinations, neutering, microchipping, dentistry, and diagnostic imaging.
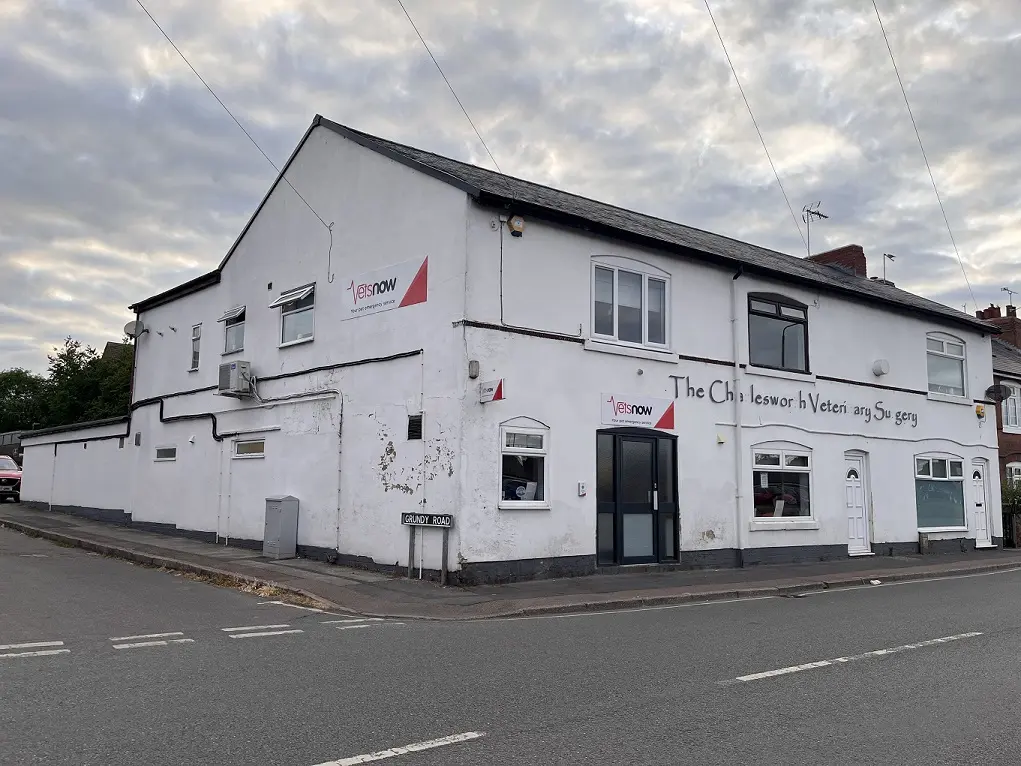
Vets Now Chesterfield provides out-of-hours veterinary care for dogs, cats and small animals when they need it most, including during bank holidays, and in urgent or emergency situations.
Charlesworth Vets is a veterinary practice in Clay Cross, Derbyshire, treating cats, dogs, small mammals, birds, and poultry. The practice opens late on Fridays and Saturdays, staying open for 24 hours. For emergencies outside normal hours, clients are referred to Vets Now Chesterfield.
Vetcare @ Home Peak Pharmacy is a veterinary practice located in the picturesque county of Derbyshire, England.
Broadleaf Dronfield Veterinary Centre treats cats and dogs in Dronfield Woodhouse, Derbyshire. The practice provides dentistry, diagnostic imaging, neutering, and vaccinations. There's a car park and disabled access.
Vets for Pets is a veterinary practice in Littlemoor, Derbyshire, treating cats, dogs and other pets. The practice opens weekdays from 8:30am to 6:30pm and Saturday mornings. It's closed Sundays and bank holidays.
Prime Veterinary Practice is a veterinary service in Chesterfield, Derbyshire, treating dogs, cats, birds, and small mammals. The practice opens weekdays and Saturday mornings.
Vets for Pets operates inside Pets at Home at Ravenside Retail Park in Chesterfield, Derbyshire. The practice treats cats, dogs, and rabbits, and stays open until 7pm on weekdays.
Spire Vets is a veterinary practice in Newbold, Chesterfield, treating cats, dogs, small mammals, birds, horses, and farm animals. The practice runs a 24-hour emergency service for registered clients.
Matt Smith Vets is a veterinary practice in Derbyshire that treats dogs, cats, small mammals, exotic pets, birds, poultry, and wild animals. The practice offers dentistry, diagnostic imaging, and routine treatments. It opens on weekends and has accessible facilities.
Carrick Veterinary Centre is a veterinary practice in Chesterfield that treats cats, dogs, exotic pets, and small mammals. The practice provides dentistry, diagnostic imaging, and routine preventative care.
Ark Vets Sheffield is a family-run veterinary practice in Dronfield, Derbyshire. The practice treats various pets and farm animals, holds RCVS Core Standards accreditation, and has on-site parking.
Chapel House Vets is a veterinary practice in Chesterfield that treats cats, dogs, birds, small mammals, exotic pets, and wildlife. The practice is open seven days a week by appointment.
Compare the fees practices have published and see the local range. We only show an item when at least two practices list a price.
71 practices with comparable prices
| Item | Typical listed price | Listed range | Practices |
|---|---|---|---|
| Emergency consultation Consultations | £230 | £75–£230 Lowest at Park Veterinary Hospital - Hope Valley Highest at Vetcare at Home | 3 of 89 |
| Follow-up consultation Consultations | £58 | £30–£68.50 Lowest at Marshall & Till Highest at Scarsdale Veterinary Group - Shelton Lock | 50 of 89 |
| Out-of-hours consultation Consultations | £189.04 | £75–£296.90 Lowest at Park Veterinary Hospital - Hope Valley Highest at Ashfield House Veterinary Hospital | 6 of 89 |
| Standard consultation Consultations | £40 | £16.50–£120 Lowest at Vets for Pets - Heanor Highest at The Travelling Vet | 68 of 89 |
| Cat booster vaccination Vaccinations | £77.97 | £50–£96 Lowest at Chapel House Vets - Chesterfield Highest at Ambivet Veterinary Group - Ripley | 48 of 89 |
| Cat primary vaccination Vaccinations | £107.33 | £70–£145.50 Lowest at Wright & Morten Vets - Whaley Bridge (Farm) Highest at Blenheim Veterinary Centre | 54 of 89 |
These are publicly listed fees, not quotes. Prices can vary by pet, weight, clinical need and what is included. For “from”, range and plus fees, comparisons use the lower published amount. Confirm the current total with the practice.
Prices checked as recently as 14 July 2026
Our directory currently lists 89 veterinary practices in Derbyshire, giving pet owners a wide choice locally. That is about 33.8 vet practices per 1,000 sq km.
Directory information last updated 22 July 2026.
Practices listed
89
shown on this page
Currently active
89
in our directory
Local choice
Broad
based on listed practices
Practice density
33.8
per 1,000 sq km
We have imported Google reviews for 84 of the 89 practices listed. Across those 549 imported reviews, the average rating is 4.5 out of 5.
Average rating
4.5/5
Practices with reviews
84/89
Reviews imported
549
These are the Google reviews imported into Vet Verified, not each practice’s complete review history. Open a practice profile to read the reviews we hold.
We have confirmed ownership information for 67 vet practices, either as independent practices or as members of a known group. We do not assume that an unclassified practice is independent.
Confirmed independent
Ownership type
1 vet practice - 1%
Known group affiliation
Ownership type
66 vet practices - 74%
Not yet classified
Ownership type
22 vet practices - 25%
1 practice is confirmed as locally owned and operated.
We base these labels on confirmed practice information and known group relationships. “Not yet classified” means we do not have enough evidence to describe the practice as independent or group-owned.
The proportion of listed practices that list care for each species.
Cats
Species
79 vet practices - 89%
Dogs
Species
79 vet practices - 89%
Small Mammals
Species
65 vet practices - 73%
Exotic
Species
25 vet practices - 28%
Birds
Species
24 vet practices - 27%
Cattle
Species
12 vet practices - 13%
The types of veterinary care listed by local practices.
Companion animal coverage
Care area
79 vet practices - 89%
Exotics and bird coverage
Care area
29 vet practices - 33%
Farm and herd animal coverage
Care area
18 vet practices - 20%
Equine coverage
Care area
11 vet practices - 12%
The services and facilities most often listed by local practices.
Microchipping
Service
60 vet practices - 67%
Vaccinations
Service
59 vet practices - 66%
Neutering
Service
58 vet practices - 65%
Dentistry
Service
51 vet practices - 57%
Diagnostic imaging
Service
50 vet practices - 56%
Flea and worm treatments
Service
50 vet practices - 56%
The opening-hours information listed by local practices.
Opening hours listed
Opening
77 vet practices - 87%
Weekend opening listed
Opening
56 vet practices - 63%
Evening opening listed
Opening
69 vet practices - 78%
Emergency periods listed
Opening
3 vet practices - 3%
Veterinary groups with branches listed in this area. We do not assume that other practices are independent.
Inspiring Vet Care
Group
25 vet practices - 28%
CVS Vets
Group
11 vet practices - 12%
Vets for Pets
Group
8 vet practices - 9%
Medivet
Group
6 vet practices - 7%
VetPartners
Group
6 vet practices - 7%
Linnaeus
Group
4 vet practices - 4%
How much contact and listing information is available for local practices.
Phone contact listed
Directory data
86 vet practices - 97%
Website listed
Directory data
88 vet practices - 99%
Email contact listed
Directory data
80 vet practices - 90%
Explore the places nearest to Derbyshire and compare more veterinary practices.
What to check before contacting a practice.